Basic service performance tuning New Relic and the python profiler
A little while ago we were working on integrating a recently built service into our main website. It had been running for a while with pretty low traffic, but was now about to be called for most page views to our side, so we were keen to make sure this endpoint was as performant as possible, both to keep the website fast and to keep the running costs down.
To reduce the risk, but still get some data to work with, we plugged it in behind a feature flag, and initially set it to the lowest setting, 1%.
Once we had some requests, we had a look in New Relic to check the performance, and were greeted by the following:
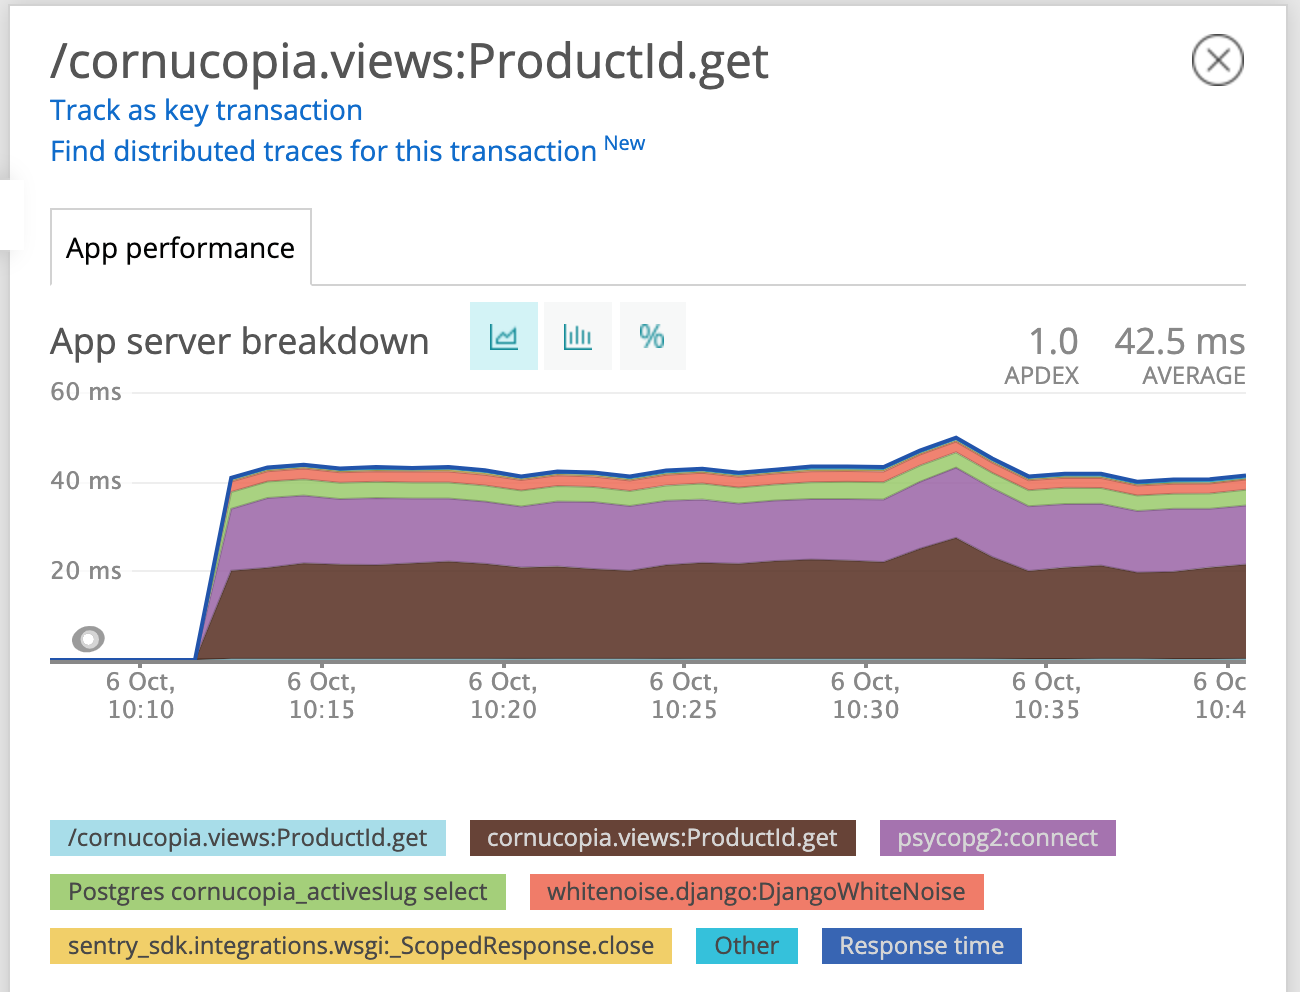
40ms looked a bit high for an API that just loads one or two rows from a db and returns a single, short string. The two largest blocks were ProductId.get and psycopg2:connect. The first was the largest, so we looked there first. Unfortunately this was as granular as the info in New Relic gets, since we didn’t have any custom traces in the code. Time to crack out the python profiler.
Python ships with a profiler and even better, IPython has some handy shortcuts for invoking it. But first we need to figure out how to execute our code. Since the requests were dependent on production data, and were only reading, it was safe enough to try in a production shell.
Using our internal tooling we launched a new docker container in our production environment, running the same image as was currently serving production traffic.
Once we had a bash prompt we disabled sentry (no need to trigger alerts if we make typos) export SENTRY_DSN='' and launched a django ipython shell django-admin shell
To send requests through the web stack in a single process it can be handy to use the django test client. The only gotcha is to make sure to set a host header to match what’s in settings.ALLOWED_HOSTS, otherwise django rejects the request.
>>> from django.test import Client
>>> client = Client(HTTP_HOST='cornucopia.srv.lyst.com')
>>> client.get('/product-id?slug=gucci-5')
<Response status_code=200, "application/json">`
Great, we can make requests. Now, the ipython “magic” %prun can be used to collect profile samples. The -D directive tells it to dump the collected stats data to a file and -q stops it from showing a basic view of the results. (The basic view is non-interactive, so it’s usually easier to browse the data with the full viewer as below.)
%prun -D /tmp/prof -q client.get('/product-id?slug=gucci-5')
With some data collected, we can launch the python profile explorer with python -m pstats
# `!` sends the command back to the bash shell
!python -m pstats /tmp/prof`
We first try sorting the profiles by time (time taken in function) and show the top 20 stats 20. (pstats lets you sort, filter as well as follow callers and callees of functions to explore where time is being spent)
Welcome to the profile statistics browser.
/tmp/prof% sort time
/tmp/prof% stats 20

Wed Oct  7 08:30:50 2020    /tmp/prof

         180385 function calls (179690 primitive calls) in 0.431 seconds

   Ordered by: internal time
   List reduced from 739 to 20 due to restriction <20>

   ncalls  tottime  percall  cumtime  percall filename:lineno(function)
      218    0.108    0.000    0.274    0.001 /usr/local/lib/python3.7/inspect.py:714(getmodule)
    31961    0.060    0.000    0.088    0.000 /usr/local/lib/python3.7/inspect.py:63(ismodule)
    31941    0.047    0.000    0.047    0.000 {built-in method builtins.hasattr}
    39437    0.036    0.000    0.036    0.000 {built-in method builtins.isinstance}
    30543    0.030    0.000    0.030    0.000 {method 'get' of 'dict' objects}
     1720    0.013    0.000    0.024    0.000 /usr/local/lib/python3.7/posixpath.py:75(join)
     1696    0.011    0.000    0.011    0.000 {built-in method posix.lstat}
      207    0.009    0.000    0.057    0.000 /usr/local/lib/python3.7/posixpath.py:400(_joinrealpath)
     1696    0.006    0.000    0.020    0.000 /usr/local/lib/python3.7/posixpath.py:168(islink)
     1048    0.006    0.000    0.019    0.000 {built-in method builtins.any}
     4334    0.005    0.000    0.005    0.000 {method 'startswith' of 'str' objects}
      649    0.005    0.000    0.005    0.000 {built-in method posix.stat}
      228    0.005    0.000    0.009    0.000 /usr/local/lib/python3.7/posixpath.py:338(normpath)
     2156    0.005    0.000    0.007    0.000 /usr/local/lib/python3.7/posixpath.py:41(_get_sep)
      206    0.005    0.000    0.223    0.001 /usr/local/lib/python3.7/inspect.py:760(findsource)
     4003    0.004    0.000    0.004    0.000 {method 'endswith' of 'str' objects}
  413/412    0.004    0.000    0.184    0.000 /usr/local/lib/python3.7/inspect.py:680(getsourcefile)
      421    0.004    0.000    0.012    0.000 /usr/local/lib/python3.7/inspect.py:642(getfile)
      206    0.004    0.000    0.329    0.002 /usr/local/lib/python3.7/site-packages/debug_toolbar/utils.py:158(getframeinfo)
     1878    0.004    0.000    0.006    0.000 /usr/local/lib/python3.7/site-packages/debug_toolbar/utils.py:45(<genexpr>)`
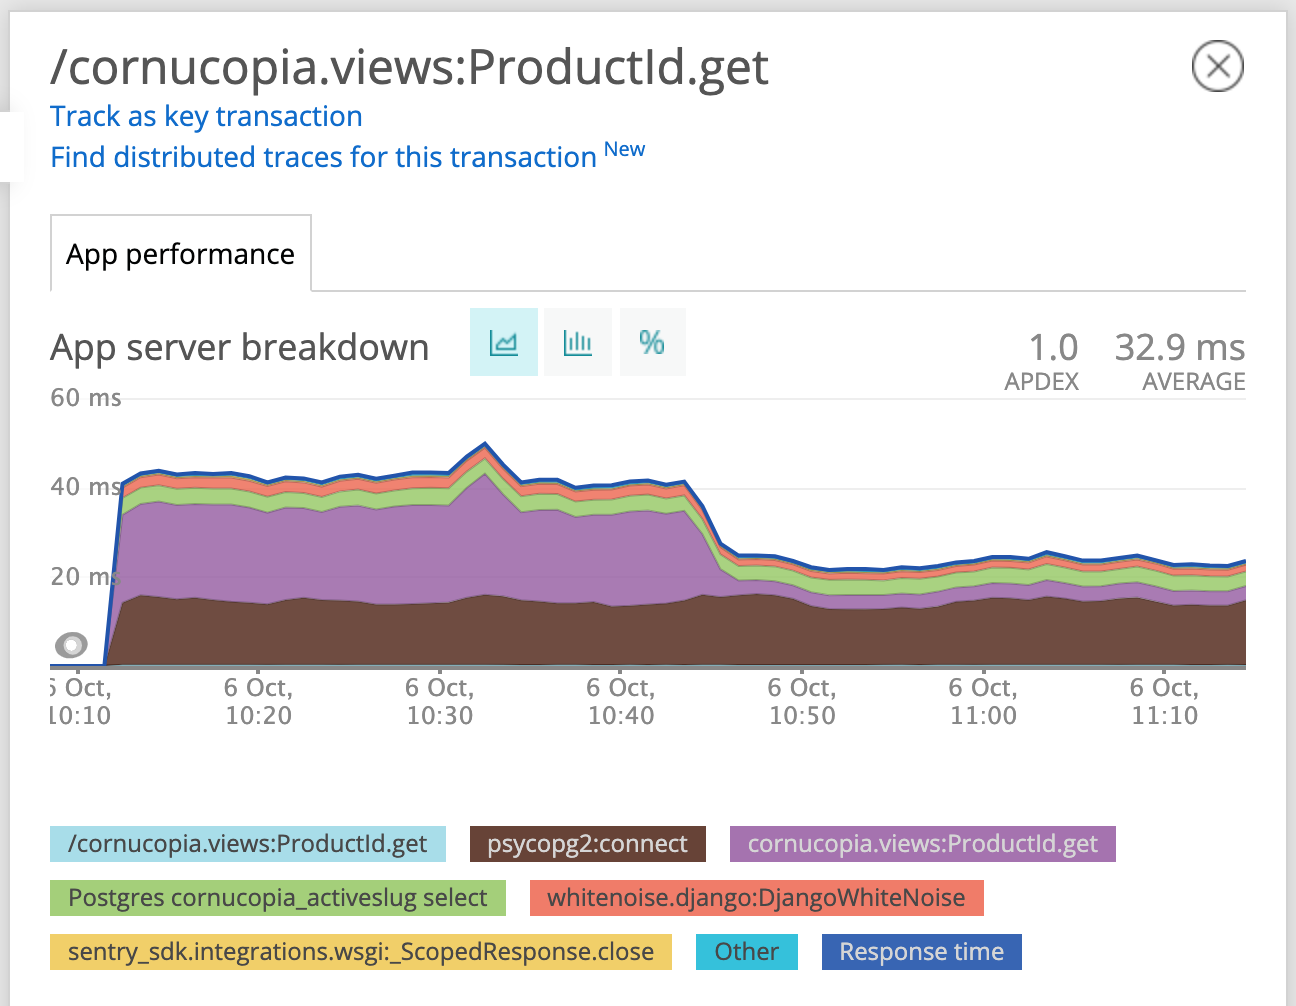
While scanning this, something immediately jumped out as suspicious. debug_toolbar (near the bottom) is the django-debug-toolbar. This is a great debugging tool, but it should not be enabled in production. A look at settings and environment variables revealed that debug mode had accidentally been left on when the service was launched. This was easily fixed by updating the environment variable we use to control whether the debug toolbar is enabled.
Once things had restarted the performance already looked better:
Time to turn our attention to that psycopg2:connect. This sounds like we were spending a lot of time connecting to (not querying) the database. For backwards compatibility reasons, django closes connections to the database at the end of each request. By setting the CONN_MAX_AGE to some positive value, we can keep connections around for that many seconds. Since cornucopia uses django-environ and db_url, this was just a matter of adding say ?conn_max_age=600 to keep connections for 10 minutes.
Another restart later:
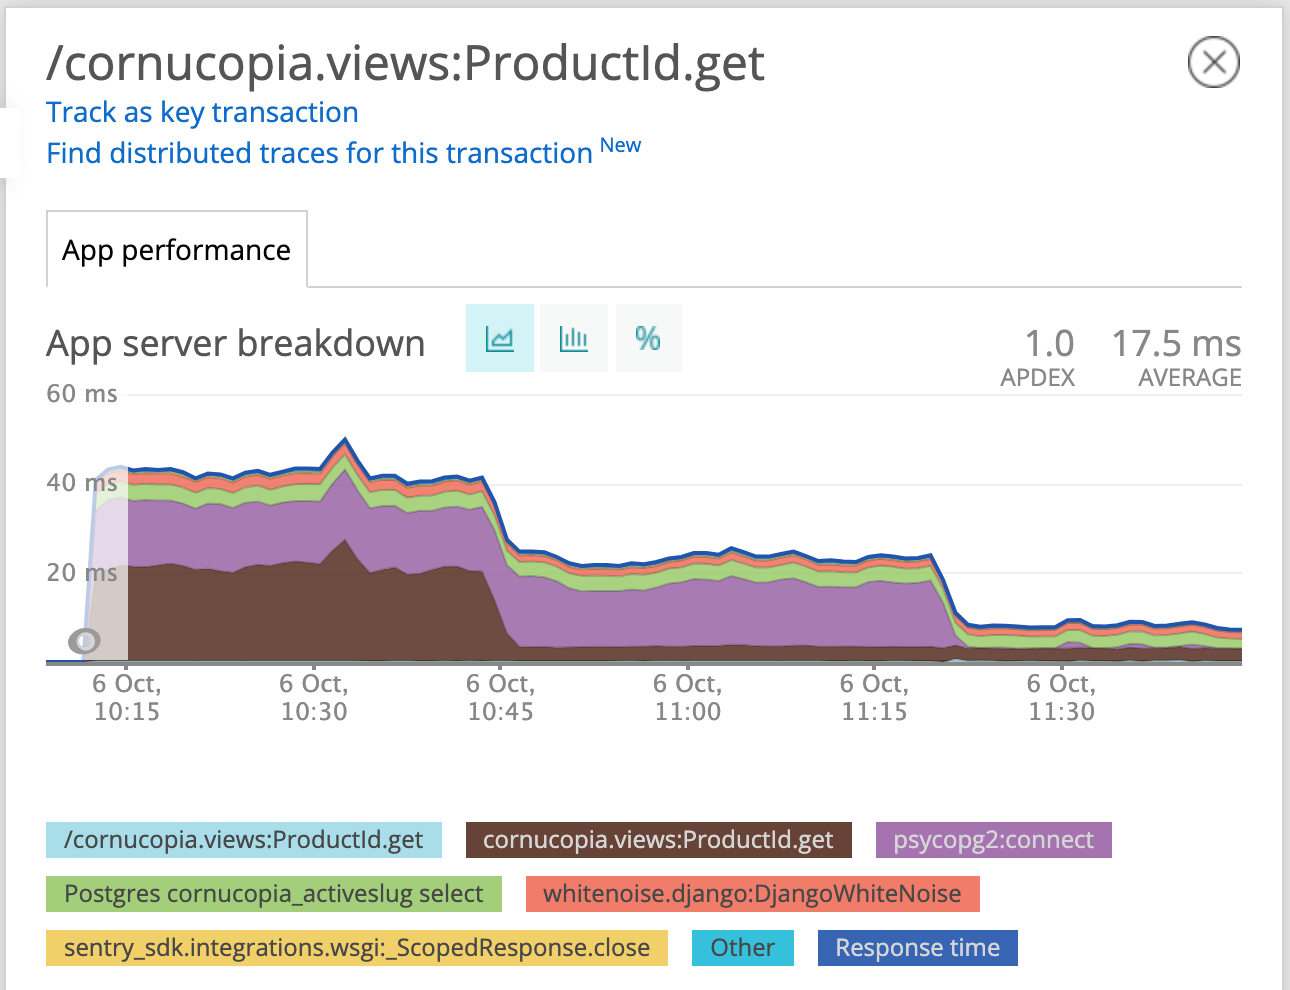
Much better!
We’re now down to ~7ms, and that held steady as we ramped up the traffic to 100%:
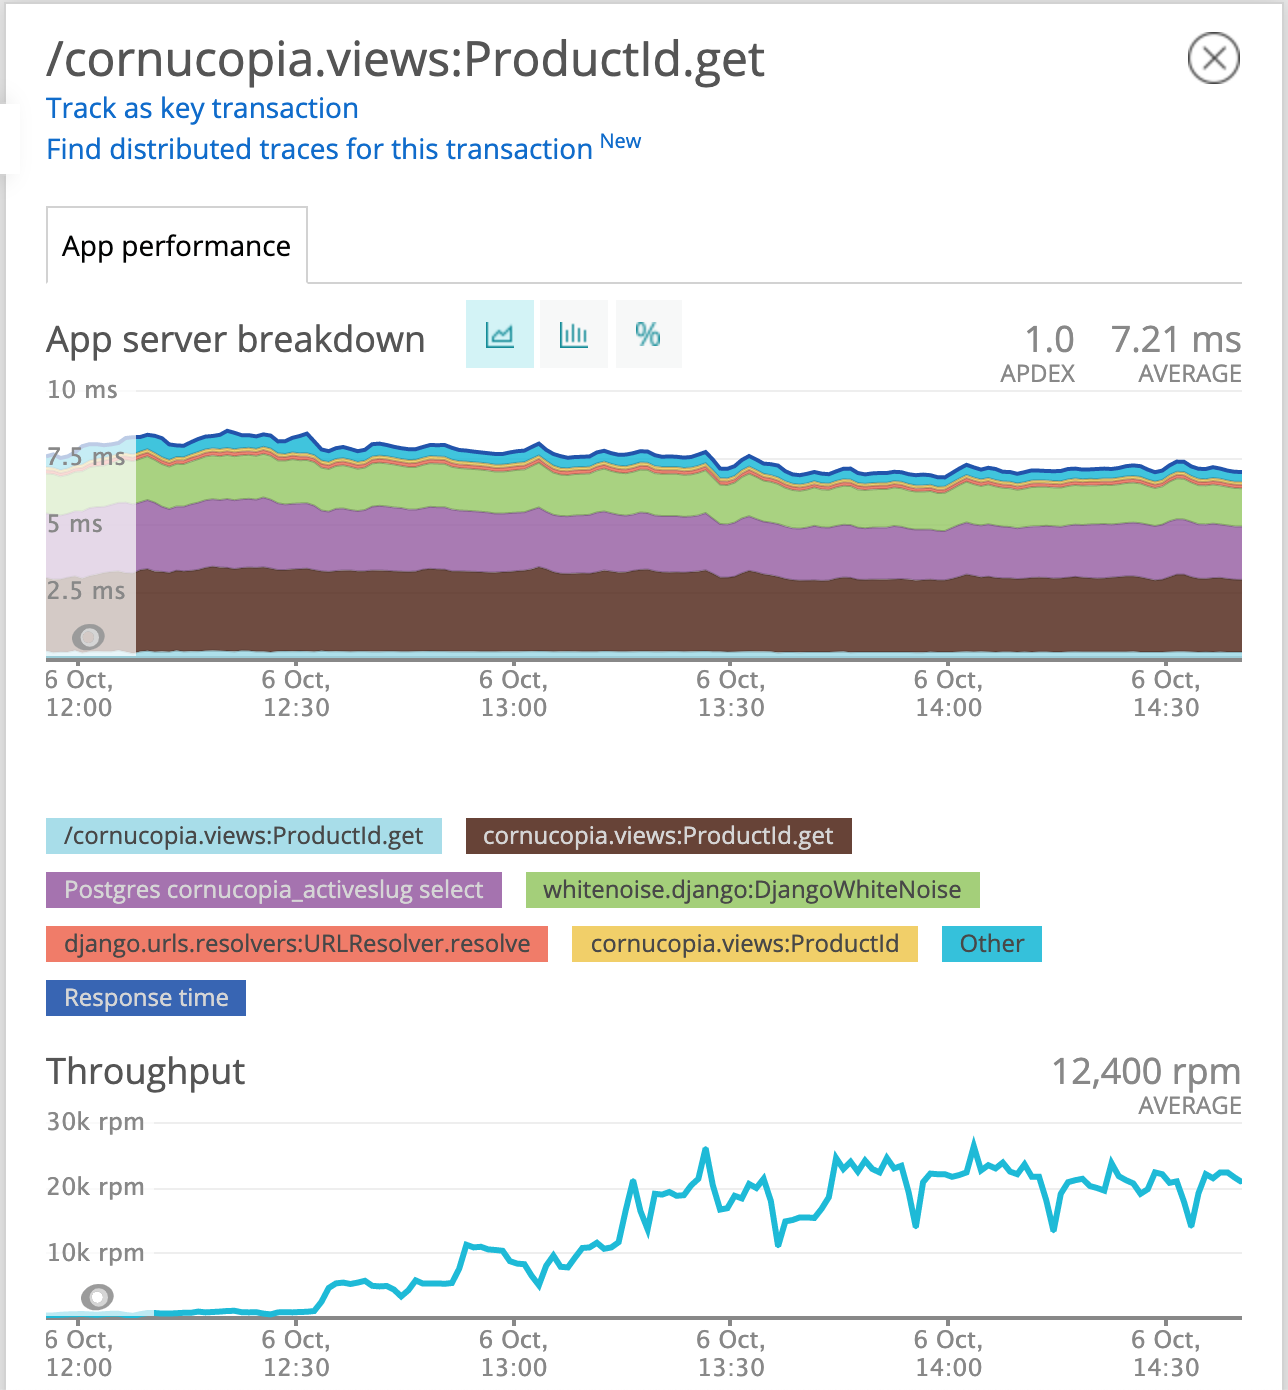
There are no longer any obvious culprits, and though we have some ideas for a few more places to squeeze out more performance, we start bumping against diminishing returns so we’re leaving it here for now.